-2.png)
Rental Market Summary & Key Takeaways
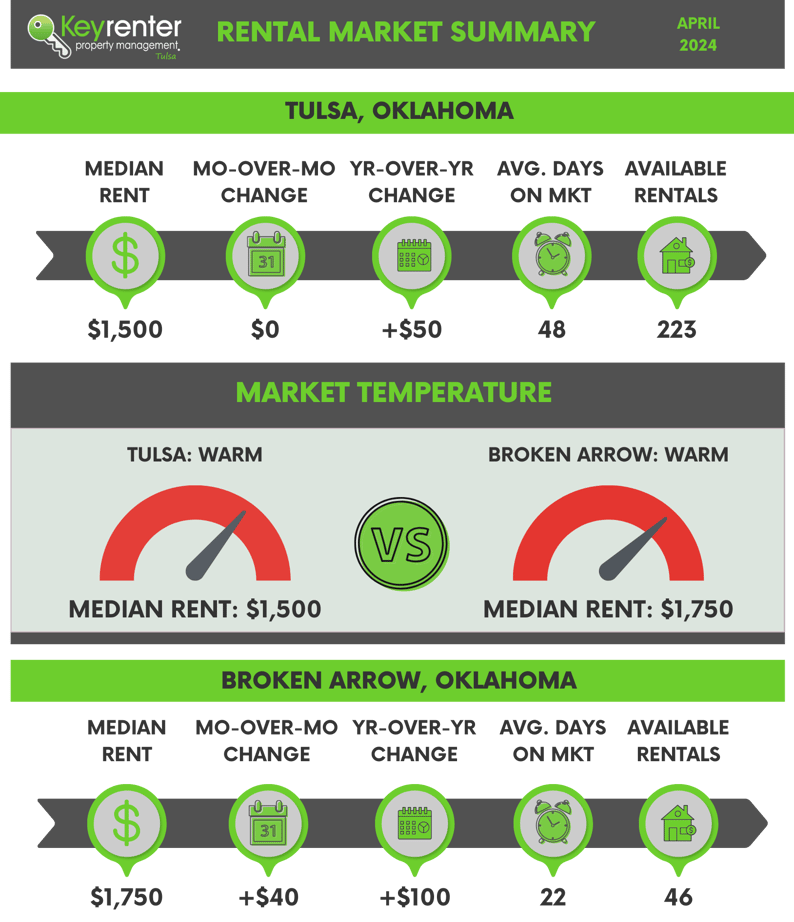
Tulsa Key Takeaways
Landlords
Slight Rent Increase: With a month-over-month increase, the market is showing signs of warming up.
Stable Year-Over-Year Growth: Modest year-over-year rent growth suggests a steadily appreciating market.
Increased Supply of Rental: A significant number of available rentals points to a competitive environment.
Tenants
Stable Prices: No annual increase offers predictability in budgeting.
Wide Selection: A large inventory suggests many options to choose from.
Warm Market: Indicates a relatively competitive market, urging quick decision-making.
Broken Arrow Key Takeaways
Landlords
Moderate Rent Increase: Both month-over-month and year-over-year rent increases.
Quicker Turnover: Fewer average days on the market suggest higher demand.
More Competitive Market: Fewer rentals available indicate a tighter market.
Tenants
Rising Rental Costs: Be prepared for increased rental prices.
Act Quickly: Faster market movement requires prompt decision-making.
Limited Options: Fewer available rentals might limit choices, increasing competition.
Sources & Additional Information:
- Market temperature is based on changes in renter demand compared to the national average.
- For example, a hot market has increasing demand.
- Temperature is based on all bedrooms and all property types.
- Median rent - 3-bedroom houses: (1) Tulsa - $1,500; (2) Broken Arrow - $1,750; (3) National average - $1,850.
- Bordo, Jonas. “The Complete 2023 Guide to Rent Prices in the US.” Accessed 20 Nov. 2023.
- Source: zillow.com 2023, rental-manager/market-trends/tulsa-ok, Accessed 22 Apr. 2024.
- Source: zillow.com 2023, rental-manager/market-trends/Broken-Arrow-ok, Accessed 22 Apr. 2024.